Yellowstone is restless. You’ve probably heard the rumors. Maybe you’ve seen those terrifying maps on social media showing a giant red "death zone" covering three-quarters of the United States. It makes for a great thumbnail, but honestly? Most of those maps are basically fiction.
If you’re planning a trip to the park or just lying awake at night wondering if Wyoming is about to delete the Midwest, you need to look at the actual data. The real yellowstone supervolcano eruption map isn't a single "game over" graphic. It’s a complex set of models that scientists like Michael Poland and the team at the Yellowstone Volcano Observatory (YVO) use to track everything from tiny hydrothermal pops to the "big one" that everyone is so obsessed with.
The Map That Actually Matters (And It’s Not What You Think)
When people search for a map of the eruption, they usually want to see where the ash goes. But geologists start much smaller. Right now, if you look at the current monitoring maps for early 2026, the activity isn't about magma. It’s about water and tremors.
The most frequent "eruption" maps aren't showing lava. They show hydrothermal explosions. Take Biscuit Basin, for example. In 2024, it had a notable explosion that sent debris flying, and even into late 2025, cameras were still catching small bursts at Black Diamond Pool.
Why the "Bullseye" Map is the Real Threat
If we talk about a massive, caldera-forming event—the kind that happened 640,000 years ago—the map looks like a giant bullseye. Traditional volcano maps look like fans because wind carries ash in one direction. But a supereruption is different. It creates something called an "umbrella cloud."
This cloud is so powerful it creates its own weather. It pushes out in every direction, even against the wind. According to USGS Ash3D models, a month-long supereruption would dump:
- Metes of ash (several feet) in places like Billings, Montana and Casper, Wyoming.
- Centimeters (a few inches) across the Midwest, like Des Moines or Minneapolis.
- Millimeters on the East and West coasts.
Basically, the closer you are, the more you're buried. But even a tiny bit of ash—think the thickness of a nickel—can short out power grids and ruin jet engines.
What the Geologic Record Tells Us
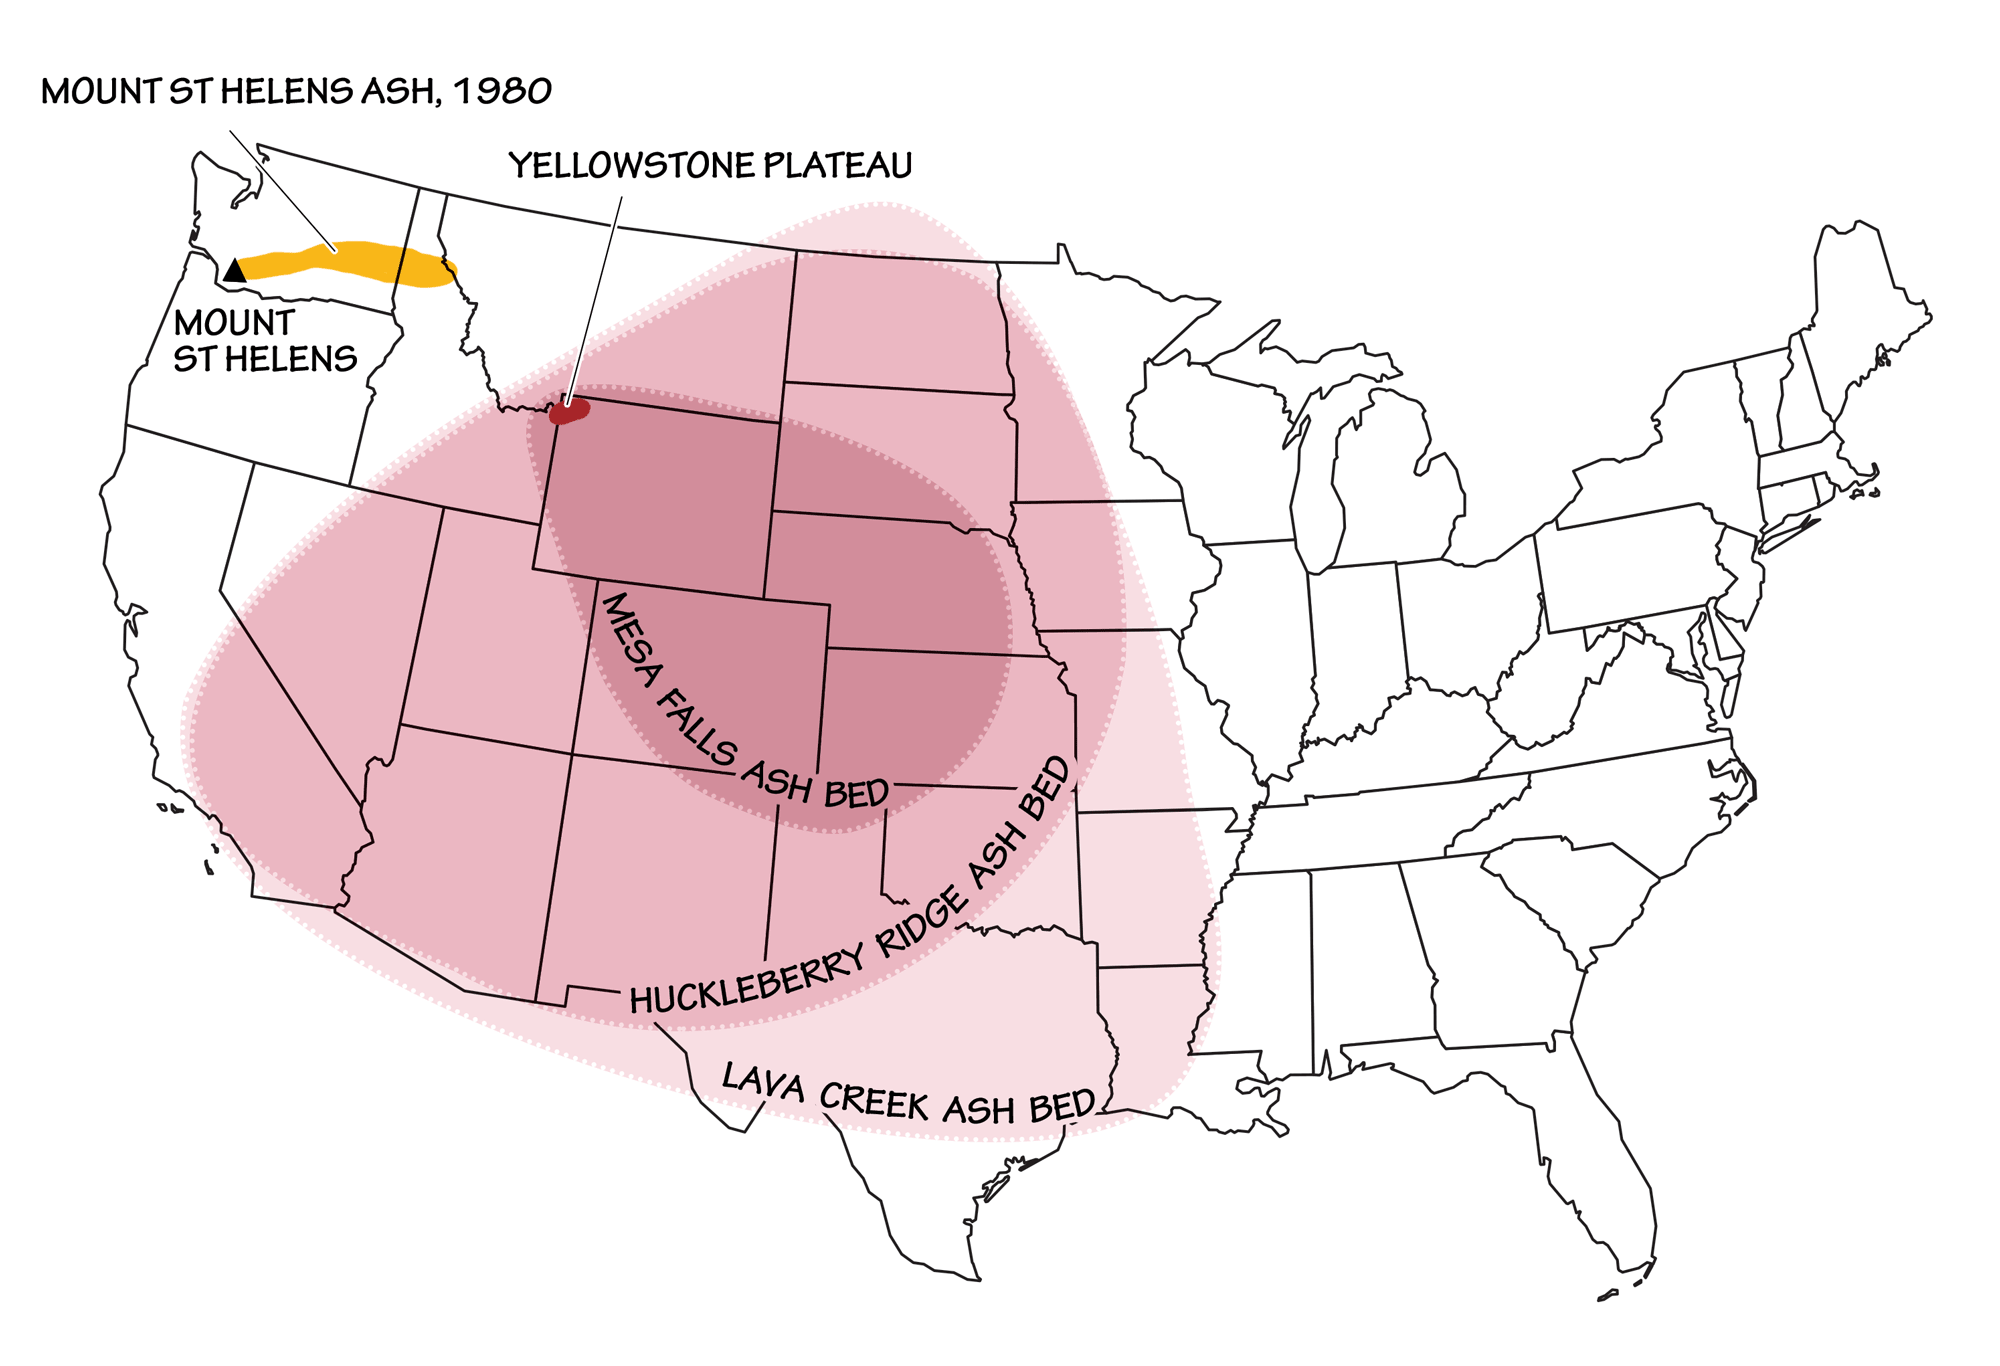
We aren't just guessing. We have the receipts. Scientists like Robert Christiansen spent decades literally walking the ground with hammers to map out where the old ash fell.
The Huckleberry Ridge Tuff from 2.1 million years ago is the big daddy. It covered over 5,790 square miles. When you look at a map of that deposit, it’s mind-blowing. It stretches across the Snake River Plain. But here’s the kicker: Yellowstone has had about 50 eruptions since the last big one 640,000 years ago. Almost all of them were just lava flows.
If a lava flow happened today, it wouldn't even leave the park. It would be a slow, oozing mess of rhyolite or basalt. It would ruin some roads and maybe burn some trees, but it wouldn't be the end of the world.
The "Overdue" Myth is Killing Me
I hear this every single day. "Yellowstone is overdue!"
No. Just... no.
Volcanoes don't work on a timer. They aren't like a bus schedule. You can't just take the average of three big eruptions and say, "Yep, we're 10,000 years late." That’s not how physics works. For an eruption to happen, you need a huge amount of "eruptable" magma—meaning it has to be at least 50% liquid.
Current seismic imaging from the University of Utah shows the magma chambers are only about 5% to 15% liquid. It’s mostly mush. It's like trying to drink a milkshake that’s mostly frozen solid. You can’t suck it through the straw.
What to Watch for in 2026
If you’re looking at the yellowstone supervolcano eruption map for signs of trouble, stop looking at the ash zones and start looking at the deformation maps.
As of January 2026, the YVO reports about 2–3 cm of uplift near the north caldera rim. Is that scary? Not really. Yellowstone breathes. It goes up, it goes down. It’s been doing this since the 70s. Unless that uplift starts happening alongside thousands of "long-period" earthquakes (which signal moving magma), it’s just the park being its usual, weird self.
How to Use This Information
- Ignore the Doomsday Channels: If a map shows ash 10 feet deep in Florida, it’s fake.
- Check the YVO Monthly Update: It’s the only source that matters. They use GPS, InSAR, and real-time seismographs.
- Respect the Hydrothermal Areas: You are 1,000 times more likely to be hurt by stepping off a boardwalk into a boiling pool than by a volcanic eruption.
- Prepare for Ash, Not Fire: If you live in the West, the real "volcano prep" is just having N95 masks and air filters. Ash is like crushed glass; it’s an irritant, not a lake of fire.
The most important thing to remember is that we would see this coming. Magma moving to the surface isn't quiet. It would cause massive swarms of earthquakes and huge ground shifts for years, maybe decades, before a super-event. Right now? The map is quiet. Enjoy the geysers.
The next step for anyone genuinely curious is to dive into the USGS Interactive Geologic Map of Yellowstone. It allows you to toggle different layers, like the 640,000-year-old "Lava Creek Tuff" boundaries, so you can see exactly where the ancient debris landed compared to modern-day landmarks.