It is mid-January 2026, and if you glance at your brokerage account right now, you’re likely seeing a number that looks nothing like the "average" annual returns you read about in textbooks. That’s because year to date stock market returns are, frankly, a bit of a chaotic mess in the short term. We just wrapped up a 2025 that defied almost every major Wall Street prediction, and now, only two weeks into the new year, the S&P 500 is already throwing curveballs.
Most people check their YTD (year-to-date) performance and immediately start sweating. They see a 2% dip or a 3% jump and assume that's the "vibe" for the rest of the year. It’s not. It’s noise. But understanding that noise is how you actually make money without losing your mind. You might also find this connected story interesting: The Broken Promise of the India South Korea Economic Corridor.
The Big Picture: Where We Stand Right Now
As of January 15, 2026, the S&P 500 is hovering around a YTD return of approximately 1.4%. Sounds boring? It’s actually fascinating when you peel back the layers. We are seeing a massive tug-of-war between the "Magnificent Seven"—those tech giants like Nvidia and Microsoft—and the rest of the market. While the headline index looks stable, the median stock in the index is actually down about 0.5% since January 1st.
This divergence matters. If you own a broad index fund, you’re smiling. If you’re a stock picker focusing on small caps or value stocks, you’re probably wondering why your screen is bleeding red while the news anchors are cheering. As discussed in latest reports by CNBC, the effects are significant.
Why Everyone Obsesses Over YTD Metrics
The financial industry loves a fresh start. On January 1st, every fund manager’s scoreboard resets to zero. This creates a psychological phenomenon known as the "January Effect," where tax-loss harvesting from December ends and investors pour fresh capital into the market.
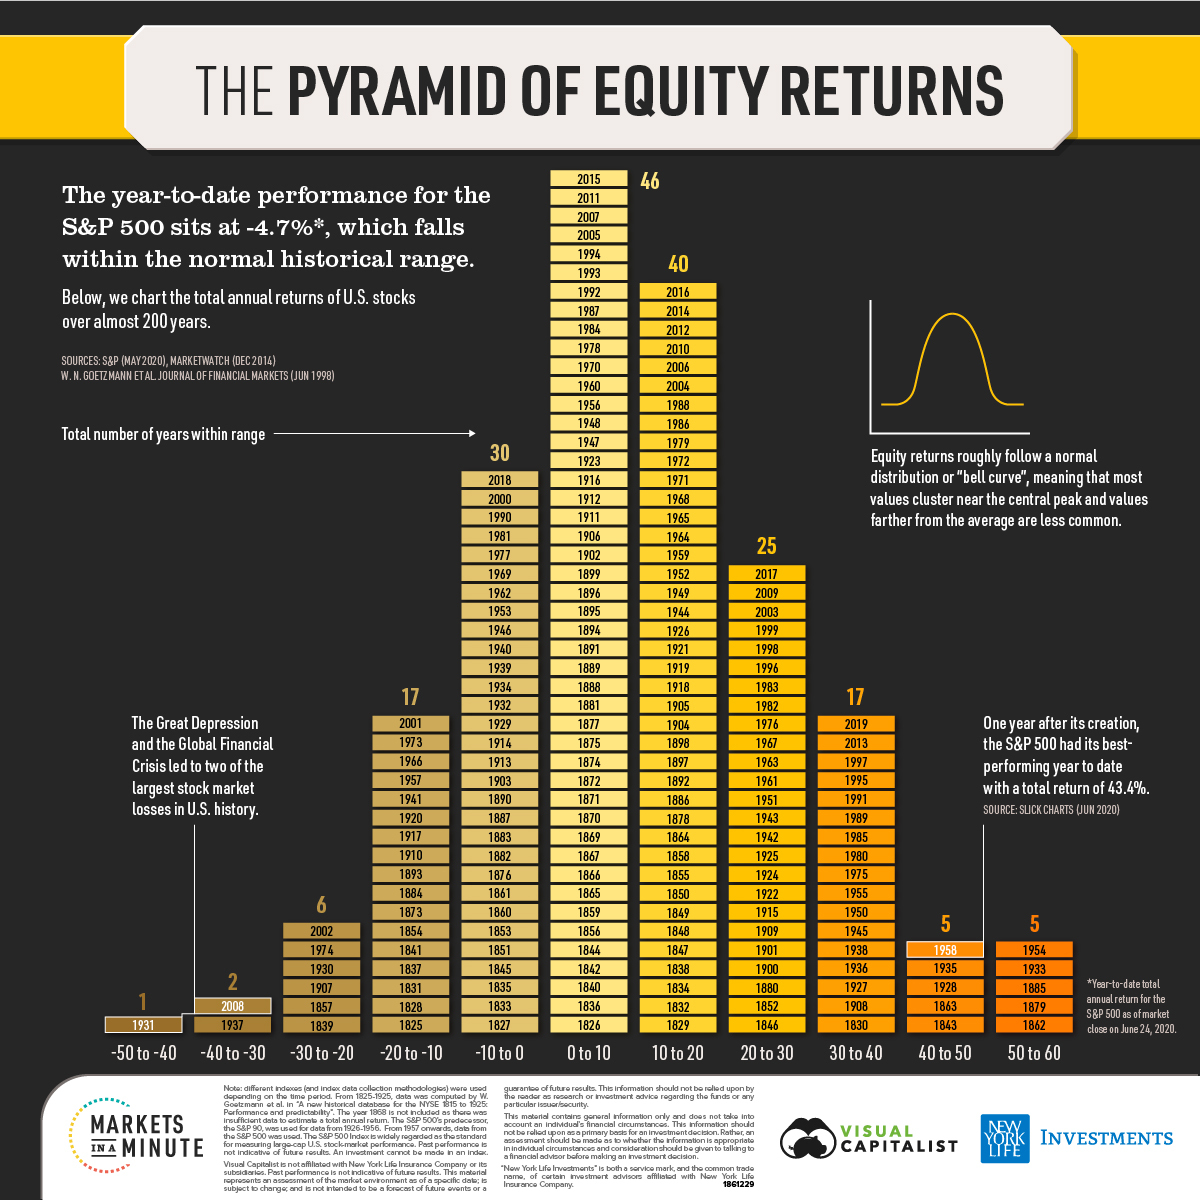
But honestly, year to date stock market returns can be incredibly deceptive. Think about 2020. By late March of that year, YTD returns were a horrific -30%. If you had sold then based on "the data," you would have missed one of the fastest recoveries in history, ending the year up over 16%.
We saw a similar story in 2023. Everyone—and I mean everyone, from Goldman Sachs to Morgan Stanley—was predicting a recession. Instead, the S&P 500 surged over 24% by year-end. If you only looked at the YTD returns in February of that year, you would have seen a flat, uninspiring market that suggested it was time to hide in cash. You would have been wrong.
The Real Drivers of 2026 Performance
What is actually moving the needle right now? It isn't just "investor sentiment." It’s math.
- The Federal Reserve's Pivot: We are finally seeing the long-awaited stabilization of interest rates. After the aggressive hikes of 2023 and the pauses of 2024-2025, the market is pricing in a "Goldilocks" scenario—not too hot, not too cold.
- AI Monetization: In 2024, AI was a promise. In 2025, it was a capital expenditure. In 2026, investors are demanding to see the "receipts." Companies that aren't showing real revenue growth from AI integration are getting punished in their YTD numbers.
- Earnings Season Jitters: We are currently in the thick of Q4 2025 earnings reports. These are the primary catalyst for the current year to date stock market returns. When a bellwether like JPMorgan or Delta Air Lines reports, it sets the tone for their entire sector.
Stop Comparing Your Portfolio to the S&P 500
Here is a truth most "experts" won't tell you: the S&P 500 is a terrible benchmark for the average person.
The S&P 500 is market-cap weighted. This means Apple and Amazon have a much larger impact on the index than a company like Macy's. If you have a diversified portfolio that includes international stocks, bonds, and maybe some real estate (REITs), your year to date stock market returns will rarely match the S&P 500.
For instance, international markets—specifically in Southeast Asia and parts of Latin America—have had a rough start to 2026 due to currency fluctuations. If 20% of your money is there, your YTD will lag. That doesn't mean you're a bad investor; it means you're diversified. Diversification is a safety net that feels like a weight when the leaders are soaring, but it feels like a life jacket when they sink.
The Role of Inflation and "Real" Returns
Don't forget the difference between nominal and real returns. If the market is up 2% YTD but inflation is still sticky at 3% annually, you're technically losing purchasing power.
In the current 2026 climate, we are seeing "disinflation"—inflation is slowing down, but prices aren't necessarily dropping. This is actually a great environment for stocks because it allows companies to maintain high profit margins while their input costs stabilize. It’s one of the reasons why the year to date stock market returns have stayed positive despite some geopolitical tension in the Middle East and ongoing trade discussions with the EU.
Sector-Specific Winners and Losers
If you look under the hood of this year's performance, the dispersion is wild.
Energy: Down 4% YTD. Crude oil prices have softened as global supply caught up with demand, hitting the big oil players hard. Technology: Up 6.2% YTD. The momentum from the 2025 AI rally has carried over, specifically in the semiconductor space. Healthcare: Flat. This sector is largely waiting for clearer signals on new pharmaceutical regulations.
This is why looking at a single YTD number for "the market" is like trying to describe a whole forest by looking at one tree. Some trees are thriving; others are being eaten by beetles.
Common Myths About YTD Returns
Let’s debunk a few things.
First, "As goes January, so goes the year." This is an old Wall Street adage that holds water about 70% of the time. But that 30% failure rate is huge. In 2018, January was incredible, and the year ended in a total bloodbath.
Second, that a "bad" YTD start means a recession is coming. Markets are forward-looking. Often, the market drops before a recession is even official and starts recovering while the news is still terrible. If you wait for the YTD returns to look "safe" before you invest, you’ve already missed the biggest gains.
How to Actually Use This Data
So, what do you do with the fact that year to date stock market returns are currently at 1.4%?
- Check your asset allocation. If your tech stocks have grown so much that they now make up 80% of your portfolio, use this YTD "green" period to rebalance. Sell some winners, buy some laggards.
- Ignore the daily percentage changes. Unless you are a day trader (and most of you shouldn't be), the daily flicker of red and green is irrelevant to your 10-year goal.
- Look at the Equal-Weight S&P 500 (RSP). This gives you a better idea of how the "average" big company is doing, rather than just the tech titans.
The Emotional Trap of "Rounding Up"
Investors have a weird habit. When the market is up 8% YTD, we tell ourselves, "I'm basically at 10%." When it's down 2%, we feel like we're losing everything.
This emotional asymmetry is why people sell at the bottom. The 2026 market is expected to be volatile. We have an election cycle looming in several major economies, shifting trade policies, and the first real "post-AI-hype" earnings season. Your YTD returns will likely swing from +5% to -3% multiple times before December 31st.
Moving Forward: Actionable Steps for Your Portfolio
Instead of obsessing over the daily move in year to date stock market returns, focus on what you can actually control.
Audit your fees. A 1% management fee can eat a massive chunk of your returns over time. If your YTD is 1.4% but your advisor takes 0.25% every quarter, you’re barely breaking even. Look for low-cost ETFs.
Automate your contributions. Dollar-cost averaging (DCA) is the only way to beat the anxiety of YTD volatility. If you invest $500 every month, you buy more shares when the YTD is negative and fewer when it's positive. It's the ultimate "set it and forget it" strategy.
Watch the 10-Year Treasury Yield. This is the "gravity" of the stock market. If yields spike, stock returns usually suffer. Right now, yields are stable, which is providing a nice floor for our 2026 YTD performance.
Review your "Why." If you need this money in six months for a house down payment, you shouldn't be worried about YTD stock returns—you shouldn't be in the stock market at all. If this is for retirement in 2045, a 1.4% YTD return is just a tiny blip on a very long line.
The market doesn't owe you a linear path upward. It’s a jagged, ugly mountain climb. The YTD return is just where you happen to be standing on the trail today. Keep climbing.
Immediate Next Steps for Investors
- Download your latest brokerage statement and compare your personal YTD return against a "total world" index like VT (Vanguard Total World Stock ETF) rather than just the S&P 500 to see if you are actually diversified.
- Identify any "zombie" stocks in your portfolio that have had negative YTD returns for three consecutive years; it may be time to cut bait and move that capital into a broad-market index.
- Increase your 401k or IRA contribution by just 1% today. This small move offsets the psychological impact of short-term market fluctuations by focusing on long-term accumulation.