If you’ve spent any time looking at your 401(k) lately, you’ve probably noticed something a bit weird. The experts spent most of last year telling us that the "Magnificent Seven" tech rally was a fluke and that a recession was basically inevitable. Yet, here we are in mid-January 2026, and the year to date Dow Jones average is already telling a much more optimistic story than the doomers predicted.
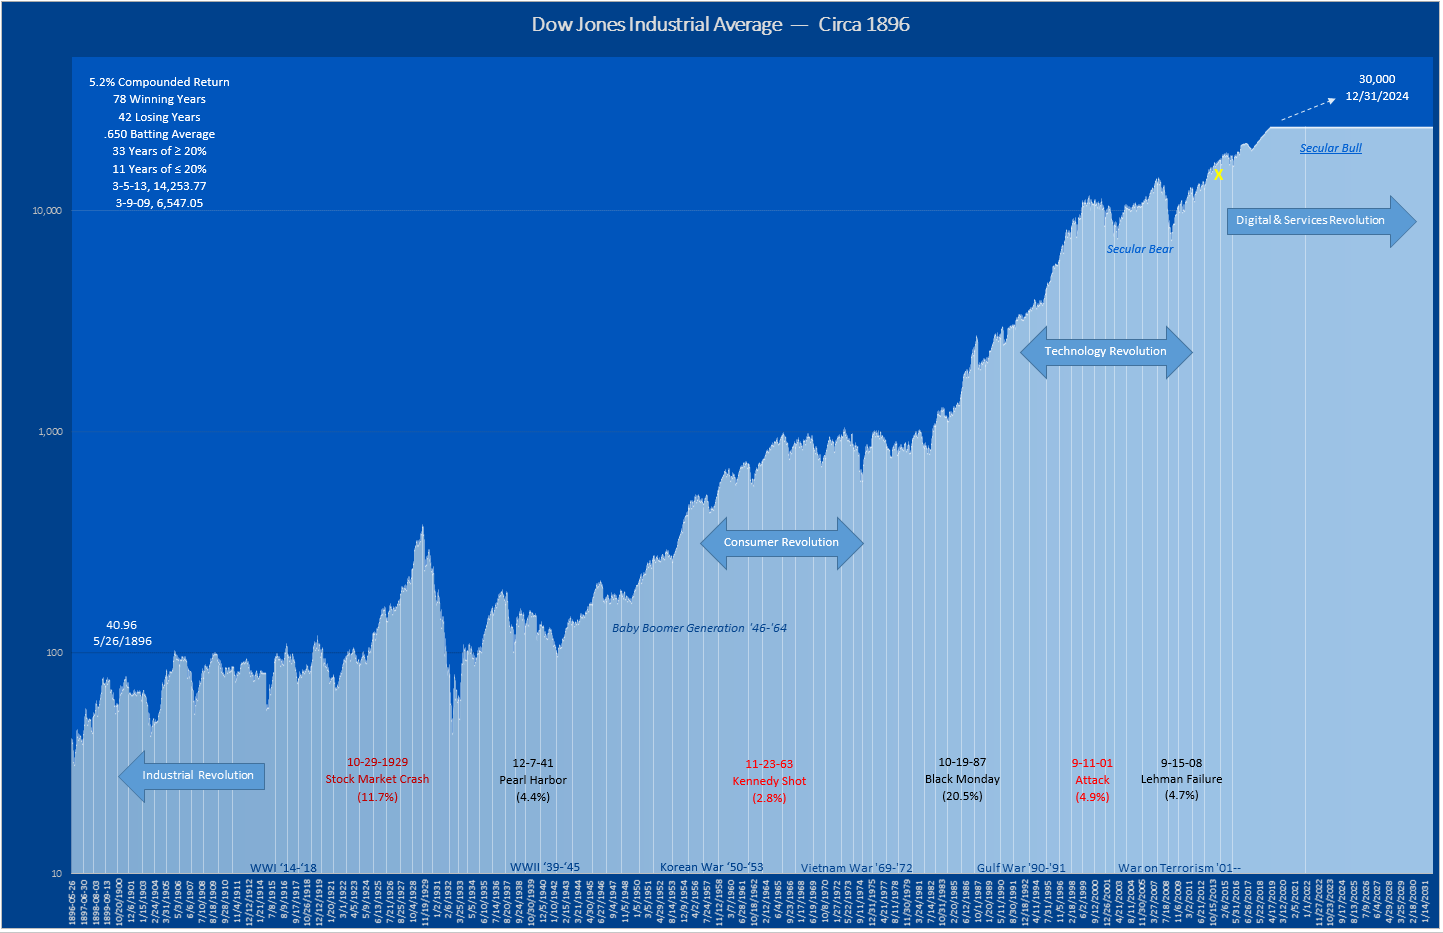
Markets are messy. Honestly, they’re rarely as clean as the talking heads on cable news make them out to be. As of January 16, 2026, the Dow Jones Industrial Average (DJIA) sits at 49,359.33, representing a year-to-date climb of roughly 2.02%. That might sound like a small number, but for a "blue-chip" index only two weeks into the year, it's a solid start. Especially when you consider we just came off a 12.97% gain in 2025.
What’s Actually Moving the Needle Right Now?
It isn't just one thing. It's never just one thing. We’re currently seeing a bizarre mix of political shifts, cooling inflation, and a very specific piece of legislation called the One Big Beautiful Act (OBBBA) that was signed last summer.
That bill basically dropped the effective tax rate for a lot of companies to near 7%. If you're a CEO at a massive Dow component like Walmart or Caterpillar, that’s a lot of extra cash to play with. This fiscal stimulus is hitting the economy right as the Federal Reserve is finally leaning toward cutting interest rates. It’s a "double-whammy" of liquidity.
The Fed’s Game of Chicken
Jerome Powell is in the hot seat. Again. Between a DOJ probe into Fed office renovations—which sounds like a plot from a bad political thriller—and constant pressure to lower rates, the Fed is walking a tightrope.
Most analysts, including those at Goldman Sachs, expect a pause in January followed by cuts in March and June. The target? Getting the funds rate down to about 3.0% to 3.25%. When borrowing gets cheaper, the 30 massive companies in the Dow generally breathe a sigh of relief.
The Surprising Winners of 2026
You’d expect the tech giants to be leading the charge, but that’s not quite what's happening. We’re seeing a "rotation." Basically, investors are getting a bit tired of overpaying for AI hype and are looking for value in boring places.
- Industrials and Materials: Sectors like Basic Materials are up over 9% YTD.
- Small-Caps vs. Large-Caps: Small-cap stocks are actually outperforming the big boys so far this year, gaining about 5.57%.
- Energy: With oil prices seeing a double-digit decline, the cost structure for transport and manufacturing is looking a lot better.
But don't count out the tech components completely. Intel (INTC) has been a monster lately, up over 32% year-to-date, fueled by domestic chip manufacturing tailwinds. Meanwhile, Boeing (BA) and Goldman Sachs (GS) are still battling volatility, showing that the "blue-chip" label doesn't always mean a smooth ride.
Why This Matters for Your Wallet
The Dow is a price-weighted index. This is a bit of a quirk that most people forget. Unlike the S&P 500, which is based on market cap, the Dow is influenced more by the actual dollar price of its stocks. When a high-priced stock like UnitedHealth Group (UNH) moves, the whole index feels it.
Right now, the year to date Dow Jones average is reflecting a "soft landing" scenario. Inflation has hovered around 3%, and while it’s not at the 2% target yet, the market seems to think we can live with it.
A Note on the "Golden Dome"
There's also some geopolitical theater at play. The Trump administration’s "SHIELD" program and "Golden Dome" missile defense initiatives have been a massive boon for defense contractors. If you're holding names like Honeywell or other defense-adjacent Dow components, you're seeing the direct result of those contract awards in the stock price.
The Risks Nobody Wants to Talk About
It isn't all sunshine. The labor market is starting to look a little "squishy." The unemployment rate for college-educated workers is 50% higher than its 2022 low. That's a red flag. If people stop spending because they’re worried about their jobs, the Dow’s consumer-heavy components like Nike or Home Depot will be the first to feel the pinch.
Then there's the AI "capex" problem. Companies like Microsoft and Amazon are spending billions—literally over $500 billion combined—on AI infrastructure. If that doesn't start showing real, tangible revenue soon, the market might lose patience. We’ve seen this movie before in the late 90s.
How to Handle the Year to Date Dow Jones Average Data
Don't panic-buy and don't panic-sell. The Dow is hovering near all-time highs, which usually makes people nervous. But historically, when the Fed cuts rates outside of a recession, the market tends to see an average annualized return of nearly 28%.
- Check your sector exposure. If you're 100% in tech, you're missing the rotation into industrials and materials.
- Watch the 10-year Treasury yield. It’s currently around 4.19%. If that starts spiking, it’ll put a lid on the Dow’s gains.
- Keep an eye on earnings. We’re entering a phase where "median" earnings are finally turning positive after a long slump. This is often a more durable signal than just a few big names carrying the weight.
The year to date Dow Jones average is a snapshot, not a crystal ball. But for now, the "Old Economy" stocks are proving they still have plenty of life left in them.
Actionable Insights for Investors
- Rebalance for Value: With tech hitting a slight slump (down 0.40% YTD), look at the dividend-paying stalwarts in the Dow that have been overlooked.
- Monitor the OBBBA Impact: Watch how companies report their effective tax rates in Q1 earnings; those benefiting most from the new tax laws may have more room to run.
- Stay Liquid: Given the 35% probability some analysts place on a recession later in 2026, keeping some "dry powder" (cash) for a potential dip is a smart move.
[/article]