When the Federal Reserve announces it will hold interest rates steady, stocks frequently flatline because Wall Street has already spent weeks pricing that exact decision into equity valuations. The real market action happens beneath the surface, driven not by the rate pause itself, but by subtle shifts in the central bank’s economic projections, bond yield spreads, and forward guidance.
Financial media loves a tidy headline. "Stocks held steady after the Fed says it won't raise interest rates" is the classic, safe framing you see across wire services every six weeks. It is technically true. It is also entirely useless if you are trying to understand how capital actually moves through the American financial system.
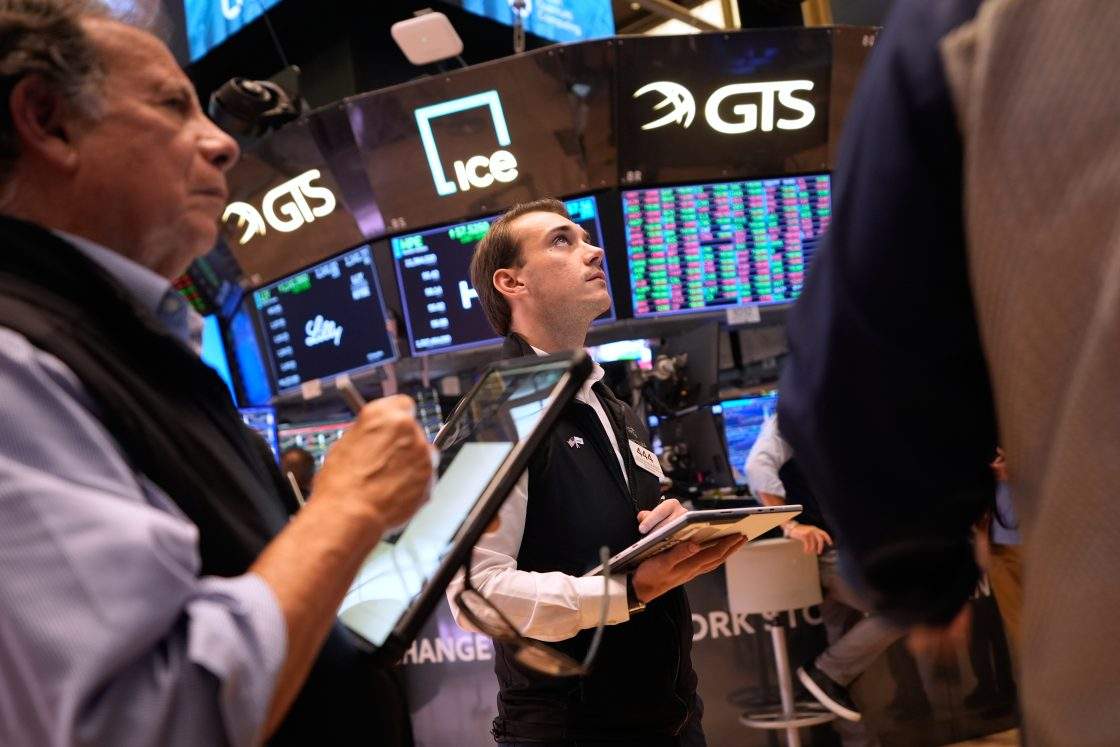
When the S&P 500 barely budges on the afternoon of a Federal Open Market Committee (FOMC) announcement, amateur observers assume nothing happened. They see a quiet ticker and move on. Veteran traders see a violent tug-of-war ending in a temporary draw. Billions of dollars are rotating out of defensive utilities and pouring into speculative software, or vice versa, while the headline index sits frozen at a 0.1% gain.
The Anatomy of a Priced-In Market
To understand why a rate pause produces a shrug on the trading floor, you have to understand how institutional capital operates. Pension funds, sovereign wealth funds, and multi-strategy hedge funds do not wait for the 2:00 PM Eastern press release to make their bets. They spend the preceding forty-five days dissecting every scrap of labor data, consumer price index print, and regional manufacturing survey.
By the time the FOMC gathers in Washington, the probability of a rate hold is usually sitting north of 95% in the fed funds futures market.
Because that outcome is already baked into the price of every share on the New York Stock Exchange, the actual announcement carries zero surprise value. In financial markets, prices do not move on good news or bad news. Prices move on news relative to expectations. If the market expects a hold and gets a hold, the net new information is zero.
The Mechanics of Discounted Cash Flows
At its core, a stock price is simply the present value of all the future cash flows a company is expected to generate, discounted back to today. The risk-free rate—typically anchored by the yield on the 10-year U.S. Treasury note and heavily influenced by the Federal Reserve's benchmark overnight rate—sits in the denominator of that equation.
When the Fed raises rates, the denominator gets larger, which mechanically shrinks the present value of future earnings. High-growth companies that promise massive profits ten years from now get crushed first. When the Fed pauses, that downward pressure stops.
Yet stopping the pressure is not the same thing as reversing it. Holding rates at an elevated plateau keeps corporate borrowing costs high, squeezes profit margins on debt-heavy balance sheets, and forces equity investors to ask a brutal question: why take the risk of owning stocks when short-term Treasury bills offer a guaranteed, risk-free return?
Reading the Dot Plot Instead of the Headline
If the rate decision itself is old news by the time it hits the tape, what are institutional algorithms scanning for in the milliseconds after the release? They are hunting for changes in the Summary of Economic Projections, commonly known as the dot plot, alongside minute edits to the official policy statement.
A single word change can trigger a hundred-billion-dollar swing in market capitalization.
For decades, Fed watchers have tracked how the committee describes inflation and employment. If the central bank holds rates steady but removes a phrase acknowledging "progress toward its inflation objective," the market instantly interprets that omission as a hawkish warning. It signals that rate cuts are further away than traders hoped.
The Trap of the Hawkish Hold
Wall Street has a specific term for a rate pause that feels like a rate hike. They call it a hawkish hold.
Consider a hypothetical scenario where the market enters a Fed meeting expecting three rate cuts over the next twelve months. The Fed announces it is holding rates steady today, matching consensus. However, the updated dot plot reveals that the median committee member now expects only one rate cut over that same period.
On the surface, the Fed did nothing. Under the hood, they just tightened financial conditions.
Bond yields spike. The U.S. dollar strengthens against foreign currencies, which immediately hurts multinational corporations that generate half their revenue overseas. Meanwhile, the headline stock index might finish the day flat because energy stocks rallied on economic strength while real estate investment trusts plummeted on higher-for-longer borrowing costs. A surface-level news report misses the entire collision.
Sector Rotation Behind the Flat Line
When an index holds steady, look at market breadth. Market breadth measures how many individual stocks are rising versus how many are falling. On a typical Fed pause day, breadth tells a wildly different story than the S&P 500 or the Dow Jones Industrial Average.
Capital does not leave the market all at once; it hides.
- Small-Cap Equities: Companies in the Russell 2000 rely heavily on floating-rate debt and regional bank loans. A rate pause without a clear path to rate cuts leaves these firms trapped under heavy interest expenses. They often sell off sharply even while mega-cap tech stocks climb.
- Consumer Staples and Utilities: Investors buy these sectors for their steady dividends. When the Fed holds interest rates at multi-year highs, a 3.5% dividend yield on a utility stock looks pathetic next to a 5% yield on a government money market fund. Money bleeds out of these safe havens.
- Mega-Cap Technology: Cash-rich balance sheets insulate the largest tech firms from high interest rates. In fact, companies sitting on tens of billions of dollars in cash actually earn massive interest income when the Fed holds rates high. They become defensive shelters disguised as growth stocks.
Watching these sectors diverge explains why an index can appear completely motionless while portfolio managers are frantically rebalancing their risk exposure.
The Dangerous Illusion of the Fed Put
For nearly thirty years, spanning the tenures of Alan Greenspan, Ben Bernanke, Janet Yellen, and the early years of Jerome Powell, investors operated under an unwritten rule known as the Fed Put. The theory was simple: whenever the stock market suffered a sharp downturn, the Federal Reserve would step in, slash interest rates, and flood the financial system with liquidity to rescue asset prices.
That era conditioned a generation of retail and institutional buyers to treat every rate pause as a guaranteed prelude to aggressive rate cuts.
History shows that assumption is extraordinarily dangerous. In the late 1960s and throughout the 1970s, the central bank repeatedly paused rate hikes and cut prematurely whenever economic growth wobbled. Each time, inflation roared back with greater ferocity, forcing the Fed to eventually slam the brakes hard enough to trigger deep, painful recessions.
Why a Pause Is Not a Pivot
A pause simply means the central bank is waiting to see how previous rate hikes affect the real economy. Monetary policy operates with what economists call long and variable lags. When the Fed raises rates today, it takes anywhere from twelve to eighteen months for those higher borrowing costs to fully filter through commercial real estate refinancings, auto loans, corporate credit lines, and consumer spending.
Holding rates steady is an act of observation, not stimulus.
If inflation remains sticky in essential services—things like housing, healthcare, and insurance—the Fed cannot cut rates without risking its credibility. If they hold rates at restrictive levels for too long, they risk breaking parts of the banking system or triggering a wave of corporate defaults. Investors who buy stocks blindly on the news of a rate pause are betting that the central bank can thread an impossibly small needle.
The Bond Market Holds the Real Veto Power
If you want to know whether a stock market rally or stall after a Fed meeting is legitimate, stop looking at the stock market. Look at the Treasury yield curve.
The bond market is vastly larger, colder, and more mathematically ruthless than the equity market. Equity investors are congenital optimists who buy stories about artificial intelligence, demographic shifts, and margin expansion. Bond traders only care about two things: getting their principal back and ensuring inflation does not eat their fixed coupon payments.
When the Fed holds interest rates steady, watch the spread between the 2-year Treasury yield and the 10-year Treasury yield.
- Bear Steepening: If the 10-year yield surges higher while the 2-year yield stays anchored to the Fed's paused rate, the bond market is screaming that inflation is not dead. Higher long-term yields will eventually crush stock valuations, no matter how friendly the Fed sounds at the podium.
- Bull Steepening: If the 2-year yield drops sharply because traders believe the economy is deteriorating so fast the Fed will be forced to make emergency cuts, stocks face an earnings recession. Lower rates do not save stock prices if corporate profits are collapsing.
Stocks only thrive in the narrow sweet spot where the Fed holds rates steady because inflation is gently cooling while employment and consumer spending remain resilient. That goldilocks environment is historically rare and notoriously fragile.
How Institutional Desks Trade the Press Conference
The true volatility on a Fed day rarely happens at 2:00 PM when the statement drops. It happens at 2:30 PM when the Federal Reserve Chair steps up to the microphone for the unscripted press conference.
Algorithmic trading desks deploy natural language processing models that parse every inflection, hesitation, and phrasing choice in real time. A prepared statement is scrubbed by a dozen PhD economists and communications directors to eliminate ambiguity. A live Q&A session with financial reporters cannot be fully scripted.
During these forty-five minutes, market liquidity often evaporates. High-frequency market makers widen their bid-ask spreads to protect themselves from getting run over by sudden order flow. This thin liquidity exaggerates price swings, creating violent head-fakes where the market rallies 1% in ten minutes only to give back the entire gain before the closing bell at 4:00 PM.
Experienced traders call this the whipsaw window. They rarely initiate major new positions during the press conference. Instead, they wait until the following morning, after the overnight futures markets in London and Tokyo have digested the commentary and established a genuine directional trend.
The Cost of Capital Never Truly Sleeps
Headline writers will always reduce complex monetary policy into bite-sized updates about whether stocks went up, down, or sideways on a Wednesday afternoon. That framing serves casual readers who want a thirty-second check on their retirement accounts.
For anyone allocating serious capital, the flat line on the chart is a warning sign, not an all-clear signal. A pause from the Federal Reserve means the central bank has stepped back to let the existing weight of interest rates do its work on the economy. Corporate balance sheets built on cheap debt are quietly rolling over into much more expensive financing, consumer savings buffers are thinning out, and profit margins are facing their toughest test in over a decade. The market is not calm; it is holding its breath while the math catches up.