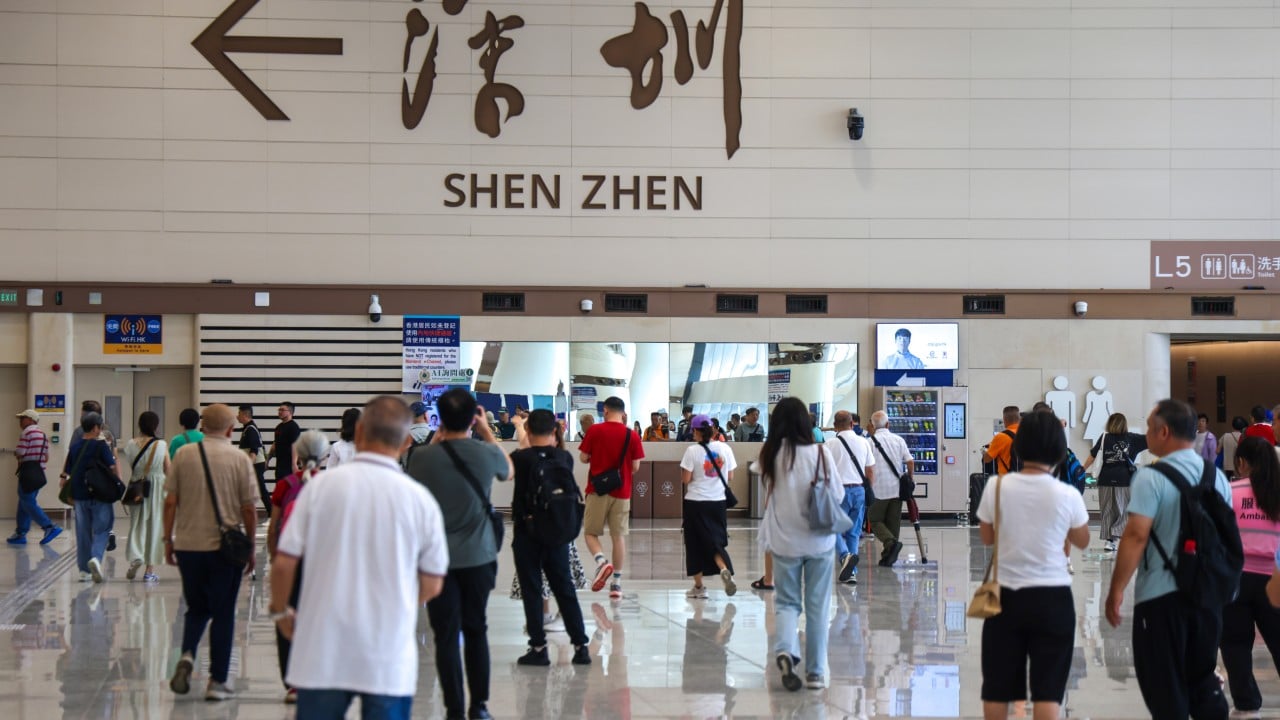
Infrastructure throughput is rarely limited by physical concrete; it is constrained by queuing theory, processing velocity, and friction at the human-technology interface. When a new port facility launches with raw volumetric data, such as the initial throughput of 79,500 passenger trips and 8,000 vehicle movements recorded on opening day at the new Huanggang Port, public discourse typically treats these figures as static milestones. For operations analysts, logistics engineers, and strategic planners, these numbers represent an initial stress test of system capacity, revealing the underlying architectural efficiency of a multi-modal border crossing. Deconstructing this volume requires examining the operational variables that dictate throughput under peak load, the bottlenecks inherent in cross-boundary transit nodes, and the systemic cost functions governing modern customs architecture.
The Throughput Equation of Multi-Modal Border Terminals
To understand the operational dynamics of a facility like Huanggang Port, one must dissect total throughput into its constituent variables: processing time per unit, parallel channel capacity, and queuing tolerance. Passenger trips and vehicle movements operate under distinct economic and operational constraints, yet they share a common dependency on digital verification systems and spatial design.
In passenger operations, throughput is governed by the friction of identity verification and baggage screening. A conventional checkpoint model relies on sequential processing, where a traveler moves from travel document inspection to biometric confirmation and physical clearance. The introduction of high-density processing models, such as collaborative inspection architectures where multiple agencies share a single data window, fundamentally alters the time-per-passenger coefficient. On opening day, managing nearly 80,000 passenger trips indicates that the velocity of digital clearance outpaced physical queue accumulation during off-peak hours, though peak-hour surges inevitably expose the limits of queue buffering.
Vehicle movements introduce a higher order of complexity. Unlike pedestrian flow, commercial and passenger vehicular throughput is bounded by turning radii, lane convergence, inspection bay dwell times, and cargo scanning technology. The processing of 8,000 vehicle movements on day one reflects a tight calibration between automated license plate recognition, radio-frequency identification tracking, and customs risk-profiling algorithms. When a vehicle enters a port, every secondary inspection requirement functions as an operational bottleneck that degrades the flow rate of the primary lane. The ratio of primary clearance to secondary intervention determines the true carrying capacity of the vehicle processing zones.
Spatial Architecture and the Minimization of Friction
Border infrastructure design is essentially an exercise in friction reduction. Every meter a passenger or driver must travel, every directional decision point, and every change in elevation introduces potential turbulence into the flow state. Modern port design relies on single-window clearance mechanisms to collapse spatial distances between sequential regulatory bodies.
The spatial layout of Huanggang Port reflects a shift from traditional linear processing to an integrated matrix model. In a linear model, delays compound sequentially; if customs clearance stalls, the entire queue backs up into immigration and ultimately onto approach roadways. In an integrated matrix model, processing nodes operate with decoupled buffers. Travelers and cargo are sorted dynamically based on risk scores computed prior to arrival or at the initial threshold. This preprocessing pipeline isolates high-risk units from the macro flow, protecting the baseline velocity of low-risk passenger and vehicle streams.
Yet, spatial architecture faces a fundamental trade-off between security rigor and operational velocity. Increasing the depth of inspection decreases systemic vulnerability but increases dwell time, which compresses total daily throughput. The opening-day performance metrics demonstrate that initial operations favored high-velocity clearance to establish baseline liquidity in the transport corridor, a necessary strategy to prevent gridlock during the launch phase when traveler unfamiliarity with new spatial layouts naturally depresses processing speeds.
The Cost Function of Peak-Load Management
Operating a major international transit node involves managing a complex cost function where the primary variables are infrastructure capital expenditure, processing labor, waiting time costs for travelers and freight operators, and security risk exposure.
During the initial deployment phase, system managers typically over-allocate processing personnel to mitigate the risk of catastrophic queue failure. This creates a high labor-cost structure that is economically unsustainable over the lifecycle of the facility. The strategic transition from initial launch to steady-state operations requires automating routine verification steps to flatten the labor cost curve while maintaining strict adherence to regulatory standards.
For commercial vehicle movements, waiting time is a direct tax on supply chain efficiency. Freight operators calculate logistics costs based on asset utilization and driver hours. A bottleneck at a port terminal ripples backward into regional manufacturing and distribution networks, inflating inventory holding costs. Therefore, the throughput of 8,000 vehicle movements is not merely a border-control metric; it is a throughput velocity indicator for regional economic integration. When processing velocity drops, the cost of friction is borne by every enterprise relying on that corridor for just-in-time delivery.
Systemic Vulnerabilities and Failure Modes
Every high-throughput infrastructure project contains structural vulnerabilities that manifest under specific operational stress scenarios. Analyzing a port's architecture reveals three primary failure modes that threaten continuous operation:
First, network dependency vulnerability is a critical constraint. Modern border facilities rely entirely on continuous, low-latency data communication between disparate government agencies, biometric databases, and vehicle registry systems. A localized network outage instantly forces automated clearance lanes into manual fallback modes, multiplying processing times and causing exponential queue growth within minutes.
Second, surge asymmetry creates severe operational imbalances. Cross-boundary traffic is rarely distributed evenly across a 24-hour cycle. Commuter peaks, holiday surges, and commercial shipping windows create extreme variance in arrival rates. Facilities designed for average throughput struggle to absorb peak multipliers without severe degradation of service levels unless dynamic lane allocation and staffing elasticity are embedded into the operational blueprint.
Third, the human interface remains an unpredictable variable. Despite advanced automation, elderly travelers, first-time visitors, and non-standard cargo shipments require human intervention. These exception cases break the rhythm of automated processing lanes, forcing operators to divert resources and reconfigure spatial flows dynamically.
Strategic Infrastructure Optimization
To transition from initial operational viability to long-term systemic efficiency, port management frameworks must move beyond simple volume tracking and focus on predictive flow optimization.
The immediate priority for optimizing a facility handling tens of thousands of daily trips is the implementation of predictive queue analytics. By deploying spatial sensors and real-time density tracking across approach roads and concourses, operators can dynamically reroute pedestrian and vehicular streams before physical bottlenecks harden into gridlock. Furthermore, shifting verification burdens further upstream through digital pre-clearance declarations transforms physical inspection points from data-collection sites into rapid-validation checkpoints.
Infrastructure resilience is ultimately measured by how the system behaves under duress. The baseline data established on opening day provides a structural benchmark, but true strategic mastery requires engineering the port's operating parameters to absorb future volume expansion without linear increases in processing friction or security compromise.